Eric Rodenbeck (Stamen, design studio in SF) just gave a nice presentation in the "Beyond the Web we know" session. He indeed showed a less known part of Web, in the shadow of social media frenziness: rich data visualization. At his studio, Eric and his team work with flows of data (from the internet and the real world) and find way to represent that data so that people better engage with them. I actually saw only one part of his talk at O'Reilly ETech 2008 and thought it would be great to bring him to LIFT Asia.
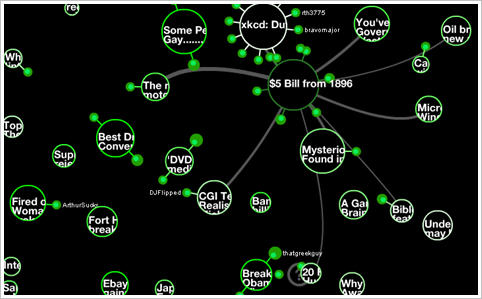
 (Picture of Stamen's Digg swarm visualization)
Eric started with the work of Etienne-Jules Marey, a french hat-lover physiologist who studied movement (heartbeat, human walking and animal movement). His talk basically showed how Marey's work could be turned as design principles for data visualizations. For example, Eric showed how Marey demonstrated how the flight of a bird is different than the flight of an insect by using representations of movements. Marey also designed hardware to represent different movements. What Stamen is doing, to my opinion is taking the same approach and use available tools (software in the present case) such as existing flows of data (taken from database for example or GPS sensors) or capture them and use Web technologies to represent/display them.
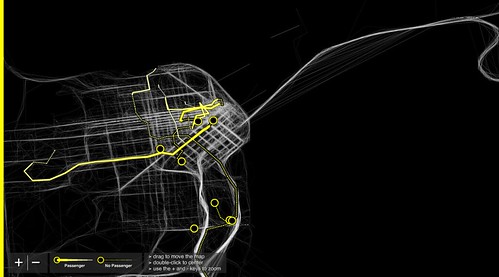
IMO the take-aways of his talk are the following issues: - repetition and measurement allow to better understand how system works, as they can reveal phenomena hidden for the person who look at it. - visualization can be very effective to tell you stories: to show patterns for example in the Digg swarm project. - use your eyes instead of your brain. - the visualizations are not always meant to find answers but they help to generate new questions for example: in cabspotting (see example below), the white lines represent taxis. As one can see, there are taxi moving close to Bay Bridge in San Francisco but they are obvisouly over the sea... how this can be possible? The thing was that GPS working fine on the top of Bay Bridge, but not on the lower part (since the upper part block the GPS signal): so the lines next to the bridge reflect the cars with GPS which does not work.
 (Picture of Stamen's Cabspotting)